Monday, March 6, 2017
CIMB - 6 Mar 17
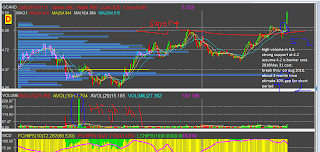
CIMB chart capture on 6 Mar 17.
Buy
Entry at 5.22 on 3 Mar 17.
Reason
From the 1st chart can seem the major cost is on 4.2 with current price about 5.4 about 28% gain from the banker cost. duration is < 6 month.
short term should be about 30 - 50% raise up gap.
but from the 2nd chart can observe the long term white line trend have turn from down towards up.
means going into bull for this stock.
Estimate it to be return to previous high at 6 to 7.
Follow up
To check again on next month Apr 17.
Subscribe to:
Post Comments (Atom)


No comments:
Post a Comment