Thursday, September 28, 2017

進撃の百萬組合 - (0)

30 Sept 2017

Summary
Target RM1,000,000.00
Current RM326,955.35
Balance RM673,044.65

MYR
Cost   RM 220,142.03
Current RM 216,272.00

HKD
Cost       HKD 131,752.01
Current HKD 181,435.00 ~ RM98,174.36 

SGD
Cost       SGD 2,322.50
Current SGD 1,630.53 ~ RM5,073.20 

USD
Cost       USD 1,759.95
Current USD 1,687.30 ~ RM7,435.79 


MYR


HKD
Stock           Qty          Price         Total Amount,HKD
tencent         300  336.30           100,890.00
ccb 2000              6.49             12,980.00
Vtech          100 112.80             11,280.00
langham 6000              3.35             20,100.00
BYD           500            73.45             36,725.00


USD
Stock  Qty  Price  total Amount,USD
FB         10   168.73     1,680.73


SGD
Stock  Qty  Price  total Amount,SGD
Ocbc   200   11.08         2,216.00


Wednesday, September 27, 2017

Case Study - Growing Stock with single QR bad Results - Q3 2017

From the recent performance on KLSE market stock, especially those have been raise up for a certain period and supported by good QR and dividend. what happen to it when a single QR drop badly. due to various of reason on sales or cost higher due commodities increase price.

we can observe below 4 Stock which have similar nature and what happen after a single QR drop badly. and is there any sign to sell before the big drop?

Namely to study on below 4 Stock
1) SUPERLN (7235)
2) MAGNI (7087)
3) OLDTOWN (5201)
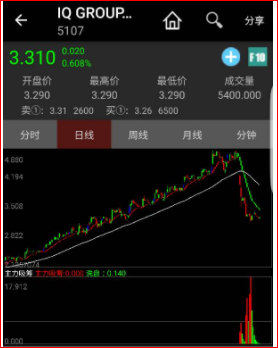
4) IQGROUP (5107)

All the above have the recent drop in QR after a steady increment of the years with 4 quarter above earning and improving profit.

lets check on the first stock,
1) SUPERLN (7235) 
- QR announce on 26 Sept 2017, with a drop of 41% compare last year quarter.
- reason sales and margin pressure by higher raw material cost.

Fundamental as below,

From the fundamental we can't find out anythings unusual, unless we can observe the price on for its cost on commodities pricing and also the selling price of its product.

Technical chart as below,
On the chart it self , we can observe there is 2 syndrome we can find out that can lead us escape from the big drop.
1) The chart trend no longer higher high , and start to lower low.
2) The buy/sell trend can help us identify to quit when it appear the sign of sell off.
based on this 2 syndrome we shall check if its applicable to others 3 stocks.


2) MAGNI (7087)
- QR announce on 14 Sept 2017, with a drop of 17% compare last year quarter.
- reason sales margin drop and margin pressure by higher raw material cost. could be lead by labour cost as well.

Fundamental as below,


Technical chart as below,
On the chart it self , we can observe there is 2 syndrome we can find out that can lead us escape from the big drop.
1) The chart trend no longer higher high , and start to lower low.
2) The buy/sell trend can help us identify to quit when it appear the sign of sell off.
the similar syndrome apply such as NO higher high. and sideways time is longer. this could be the time to dump off the stock quietly.


3) OLDTOWN (5201)
- QR announce on 25 May 2017, with a drop of 46% compare last year quarter.
- reason sales margin drop and margin pressure by higher raw material cost.

Fundamental as below,


Technical chart as below,
On the chart it self , we can observe there is 2 syndrome we can find out that can lead us escape from the big drop.
1) The chart trend no longer higher high , and start to lower low.
2) The buy/sell trend can help us identify to quit when it appear the sign of sell off.
But for Oldtown the above can't really applicable as there is only 1 top form and sudden come out with poor QR and gap down. perhaps can refer to the peak candle with long shadow line as one the risk coming.


4) IQGROUP (5107)
- QR announce on 29 Aug 2017, with a drop of 60% compare last year quarter.
- reason sales margin drop and margin pressure by higher raw material cost.

Fundamental as below,


Technical chart as below,
On the chart it self , we can observe there is 2 syndrome we can find out that can lead us escape from the big drop.
1) The chart trend no longer higher high , and start to lower low.
2) The buy/sell trend can help us identify to quit when it appear the sign of sell off.

as for IQgroup can be same pattern such as no higher high.
think another observe is the stock have accumulate a lot of gain since last 1 years. and the risk have increase. with the recent drop there have been activity on accumulating the stock at bottom.


Conclusion
Based on the four stock above all of them have the same impact on 1 QR poor results, and resulted in gap down due to this, but the gap down is much related to the QR drop in percentage.
below items can be notice through out case study.
From Technical wise
1) when stock in uptrend and after gain for a long time did not break higher high uptrend momentum can consider as 1 risk occur.
2) check on the chart buy/sell signal if turn to downwards shall beware.
3) if the peak have too long shadow line on the peak candle means the selling pressure is high. can be seen as a risk as well.
From Fundamental wise
1) observe on the cost of the company especially when commodities price up or down what is the impact towards the company cost structure as well the sales margin if improve or decrease.


Monday, September 25, 2017

00034 九龍建業 - 25 Sept 17


The recent stock fundamental can be shown as above picture.
on technical chart have show recently weakening but got support at below 8.8-8.6.

10 years Fundamental show as below,
obviously if compare to history current PE is consider highest at the moment.
perhaps a more reasonable would be around PE 7 to 8


On the technical chart show the price still on uptrend. unless the uptrend line broken it will continue stay uptrend.


Summary
Overall is a good stock where pay stable dividend as well good yield and payout ratio about 50% to 70%. 
just the recent PE consider highest at historical. so shall always remind that don't earn dividend but loss the capital. 
perhaps a better entry point would be around PE 7 - 8 region. refer to technical to find a better buy in point.


Hong Kong Stock Category

50 Stock for Hk.
the book good for beginner who not know much for hk stock.
intro most of the stable and steady stock in hk.
especially those utilities stock all has stable performance over the years.

公用事業:
-- 中電控股(0002)
-- 中華煤氣(0003)
-- 電能實業(0006)
-- 港燈公司(2638)
-- 華潤電力(0836)
-- 中國電力(2380)
-- 粵海投資(0270)

地產:
-- 九龍倉(0004)
-- 新鴻基地產(0016)
-- 太古地產(1972)
-- 華南城(1668)

房託:
-- 陽光房產(0435)
-- 領展房託(0823)

飲食:
-- 大快活(0052)
-- 維他奶(0345)
-- 康師傅(0322)
-- 中國旺旺(0151)
-- 蒙牛乳業(2319)
-- 青島啤(0168)

金融:
-- 港交所(0388)
-- 建設銀行(0939)
-- 工商銀行(1398)
-- 中銀香港(2388)
-- 英國保誠(2378)

運輸交通:
-- 港鐵公司(0066)
-- 深圳高速(0548)

運輸工程:
-- 港機工程(0044)

家居用品:
-- 創科實業(0669)
-- 海爾電器(1169)
-- 維達國際(3331)

保健護理:
-- 白花油(0239)
-- 恒安國際(1044)

零售:
-- 六福集團(0590)
-- 周大福(1929)

能源:
-- 中海油(0883)
-- 神華能源(1088)

基建:
-- 長江基建(1038)

建築材料:
-- 安徽海螺(0914)

電訊:
-- 數碼通(0315)

博彩:
-- 金沙中國(1928)

Book Review - 催化劑投資法2——兩極時代的價值倍升股


This book introduce much on the HK stock and sort. most of the HK blue chips have stable performance over the years and overall the Dividend Yield is much higher compare to blue chips in Malaysia But one must not earn the dividend but loss the stock price. as the dividend is easy to predict but the price movement not. need to refer back to the historical fluctuation of the price over the past 10 years. Similar as below table 1.
Table 1


Some of the particular common blue chips stock in HK as below.
3 of power stock 1 gas and property REIT.
these stock meet the selection criteria of Stable dividend, dividend yield better than FD and possibility of higher dividend in future. 

As one of the common REIT stock LINK 

As another one HK MRT 
Buy point refer to 200MA near by or below this line can consider buy.


Finally monopoly business stock , HK Exchange

Conclusion
This book bring much idea on the recent stock and performance in Hong Kong stock selection.as value investment one must buy at relatively low price and hold for a period of time. but need beware of the stock as not to buy and forget as the future business model may vary from times to times. but overall utilities stock is much stable compare to tech stock. 


Thursday, September 21, 2017

TD Ameritrade T/T

After checking several bank facilities in Malaysia, so far found HLB provide the best max amount to transfer and also best exchange rate. Cost wise is not that high in compare.

Max Limit - RM 45,000
Cable charges RM 20 + RM 1.20 GST.
Well Fargo Bank charge USD 15.
But the problem is the transfer take time > 1 day to complete. quite slow in compare to others.

Take note when doing transfer need extra caution on the exchange rate instead of just the cost, as the higher amount transfer will lead to higher differences.

Below Comparison done.

Summary
In compare HLB provide best USD exchange rate and lowest cost.

Saturday, September 16, 2017

讓錢自已流進來

讓錢自已流進來

讓錢自已流進來

有錢人看收入,都是看非薪資收入,也就是說,有錢人的收入來源以及收入結構,和一般人是截然不同的,這兩項因素將決定你是不是真正擁有財務自由。只有窮人才會只看薪資收入,滿心記掛這個月賺多少錢,下個月要賺多少錢。」

那一刻,我完全被震懾住了。從那時候起,我才知道什麼叫真正的財富。

這麼說吧,我這個老闆即使不工作,每個月還是有五百萬以上的持續收入,其中包括四棟大樓的出租費用和一些投資獲利及公司股東分紅。

他讓我知道,原來有錢的人都在花時間建構系統,沒有錢的人,卻把時間花在找工作,然後再把時間花在工作上。

以下為稅制.

個人打工      收入- 稅金 =  可用支出 所得最少
以樓收租      收入- 支出- 稅金= 可用支出 比打工好
公司              收入- 支出- 稅金 = 利潤 比打工好
資本家              資本增值, 股息收入. 冇稅 -->最好
以股息為收入     股息收入. 冇稅 -->最好


Friday, September 15, 2017

Magni - Poor QR 18Q1 - 15 Sept 17

Magni review

On after announcement of QR Magni have drop significant. the poor QR have trigger a huge drop in price on first day expect the drop will be continue as now KLCI consider weak due to N.K missile testing.

below chart today.

as can be seen today once open have drop 13%
supported with huge volume means alots of buy and sell in transacted.
but big gap down should be institute or big shareholder only can make such.
so who is the buyer?
the near support can be see to be at around price 6.

Fundamental 
PE now is around 8.87, historical PE around 6~7.
by forecast once this deep drop will resulted in slightly rebound and then side way.
the revenue up but the profit drop. good is revenue up but why the margin is drop?
was said is due to forex loss instead of gain.


Technical
don't intend to catch a fallen knife, wait it lay on floor no people want then start to buy it.
another synonym can be seen as the price sideway and can't break thru means the uptrend movement have stop. the risk is there.
another is refer to shareholder selling all the time before QR out. shall refer as a sign to quit in future.
Magni chart as of 15 Sept 17

Magni QR

Magni recent changes

Magni PE

Reassessment on Wood industry Hevea

On the last Blog,
https://edge2015.blogspot.my/2017/09/wood.html
it was said that mieco is much better than hevea due to small and potential to growth big.

on the recent post(15 sept 17) as below.

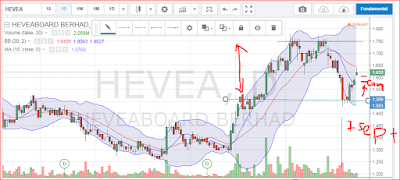
HeveaBoard Bhd is expected to have a fruitful year in 2018, with room for price adjustment for its products and better margin for its ready-to-assemble (RTA) furniture.

HLIB Research maintained its “buy” recommendation with unchanged target price of RM2.19. Its sensitivity analysis indicates that every 10 sen appreciation in ringgit against the US dollar will decrease Hevea’s profit by 11%, assuming a constant ASP.

On the chart wise,
we can see that after the news out Hevea started a sharp drop and side way.
and as of today gap up again due to HLB suddenly good review?
look at Mieco in compare the stock shoot up high after the news. and side way now.
it meets long term resistance. expect will remain side way for some time.

Conclusion
the research report will bring some impact on the price movement as it may influence some of the market sentiment, but to overcome shall have lead back to PE and valuation and prospect for future.
do not take all words from research house as true as they always change from time to time.

 Hevea as of 15 sept 17
Mieco as of 15 sept 17

Monday, September 11, 2017

Masteel 5098- 11 Sept 17

Masteel - 11 Sept 17

The review done on 11 Sept 17.

Chart 1 
on the short term the stock break thru the near term resistance of 1.27.
but the last candle show no head and tails.
means the uptrend strength have weaken.
but on the MCD part, the purple line is upward cross pink line.
indicate there is further uptrend in the near future. 

Chart 2
indicate the all time chart the highest point is around on 2008 year. around 1.2.
current price have break thru all time high.
if can persist it shall indicate 1 time return from the box space.
the buy point shall be the retreat of the current pricing and not supported at the resistance.

Chart 3
From the deviation expert shows that the fund inflow is align with the stock performance.
point A show the last time purple line upward cross pink line with red candle at 75% above stock price still able to go up. point B is exactly same as point A also with red candle > 75%(slightly higher than point A)

Conclusion
when the price fall not and supported at 1.2 then can consider good point to enter. price have break thru all time high. there is no resistance.


Chart 1
Chart 2
Chart 3


Pmetal - 11 Sept 17

Pmetel price break thru. 9 Aug 17.

Case study
On the chart break up on around 9 Aug 17 with volume as support afterwards price keep moving up.
it is common side way and break thru history resistance.
but i think this need to be support by good fundamental.
QR release on 16 Aug 17. smart money know the results before announcement.


As for lion industry 11sept 17

in compare the side way period is shorter compare to Pmetal.
and the break out on 9 sept 17
volume is lesser compare to pmetal as well.
to observe if this break out can maintain?


As for Masteel 11 sept 17

Similar break thru as well. the period is shorter sideway in compare but the break out volume is much compare to lionind. so expect masteel can sustain the uptrend further.
break thru on 7 sept 17.

As for South steel 11 sept 17

As for Ssteel it break out earlier compare to others 2.
with volume supported.
but there is selling pressure after the break out and recently have break thru again and become doji. short term shall fall back and uptrend again.