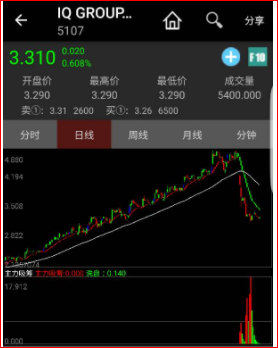
we can observe below 4 Stock which have similar nature and what happen after a single QR drop badly. and is there any sign to sell before the big drop?
Namely to study on below 4 Stock
1) SUPERLN (7235)
2) MAGNI (7087)
3) OLDTOWN (5201)
4) IQGROUP (5107)
All the above have the recent drop in QR after a steady increment of the years with 4 quarter above earning and improving profit.
lets check on the first stock,
1) SUPERLN (7235)
- QR announce on 26 Sept 2017, with a drop of 41% compare last year quarter.
- reason sales and margin pressure by higher raw material cost.
Fundamental as below,
From the fundamental we can't find out anythings unusual, unless we can observe the price on for its cost on commodities pricing and also the selling price of its product.
Technical chart as below,
On the chart it self , we can observe there is 2 syndrome we can find out that can lead us escape from the big drop.
1) The chart trend no longer higher high , and start to lower low.
2) The buy/sell trend can help us identify to quit when it appear the sign of sell off.
based on this 2 syndrome we shall check if its applicable to others 3 stocks.
2) MAGNI (7087)
- QR announce on 14 Sept 2017, with a drop of 17% compare last year quarter.
- reason sales margin drop and margin pressure by higher raw material cost. could be lead by labour cost as well.
Fundamental as below,
Technical chart as below,
On the chart it self , we can observe there is 2 syndrome we can find out that can lead us escape from the big drop.
1) The chart trend no longer higher high , and start to lower low.
2) The buy/sell trend can help us identify to quit when it appear the sign of sell off.
the similar syndrome apply such as NO higher high. and sideways time is longer. this could be the time to dump off the stock quietly.
3) OLDTOWN (5201)
- QR announce on 25 May 2017, with a drop of 46% compare last year quarter.
- reason sales margin drop and margin pressure by higher raw material cost.
Fundamental as below,
Technical chart as below,
On the chart it self , we can observe there is 2 syndrome we can find out that can lead us escape from the big drop.
1) The chart trend no longer higher high , and start to lower low.
2) The buy/sell trend can help us identify to quit when it appear the sign of sell off.
But for Oldtown the above can't really applicable as there is only 1 top form and sudden come out with poor QR and gap down. perhaps can refer to the peak candle with long shadow line as one the risk coming.
4) IQGROUP (5107)
- QR announce on 29 Aug 2017, with a drop of 60% compare last year quarter.
- reason sales margin drop and margin pressure by higher raw material cost.
Fundamental as below,
Technical chart as below,
On the chart it self , we can observe there is 2 syndrome we can find out that can lead us escape from the big drop.
1) The chart trend no longer higher high , and start to lower low.
2) The buy/sell trend can help us identify to quit when it appear the sign of sell off.
as for IQgroup can be same pattern such as no higher high.
think another observe is the stock have accumulate a lot of gain since last 1 years. and the risk have increase. with the recent drop there have been activity on accumulating the stock at bottom.
Conclusion
Based on the four stock above all of them have the same impact on 1 QR poor results, and resulted in gap down due to this, but the gap down is much related to the QR drop in percentage.
below items can be notice through out case study.
From Technical wise
1) when stock in uptrend and after gain for a long time did not break higher high uptrend momentum can consider as 1 risk occur.
2) check on the chart buy/sell signal if turn to downwards shall beware.
3) if the peak have too long shadow line on the peak candle means the selling pressure is high. can be seen as a risk as well.
From Fundamental wise
1) observe on the cost of the company especially when commodities price up or down what is the impact towards the company cost structure as well the sales margin if improve or decrease.


No comments:
Post a Comment