Thursday, March 9, 2017

Wednesday, March 8, 2017
Stock Pick
Consideration while doing any stock pick
This method relatively low risk as purchase point have ensure the level of further drop is less.
but disadvantages will be it take long time to realized gain.
consider one of save method to choose stock.
b) sell when no growth
c) hold if long growth
d) sell if short growth
This method relatively low risk as purchase point have ensure the level of further drop is less.
but disadvantages will be it take long time to realized gain.
consider one of save method to choose stock.
一、公司基本面:
1. Profit
Trend:净利稳健,并能持续。
2. PE
Ratio :本益比<10,
最理想是<8。
3. Div. &
DY :股息>4分,最理想是>8分;周息率>4%,
最理想是>8%。
4. Financial
Status: 财务上拥有可观的保留盈余及净现金。
二、公司技术面:
1. Price :股价处于最低价的<10%范围。
2. Price Trend:
股价趋势处于下跌后期,筑底或上升开始前。
3. Reward/Risk
Ratio :股价上升空间大,下跌空间小。
三、整体市场概况:
1. 从世界经济与指数图表评估,股市不会崩盘。
2. 股市已严重超卖。
from
http://nifong.blogspot.my/2017/02/blog-post_19.html
But cold eye more focus on growth potential and cash flow
rather than just safe.
as growth is key to gain instead.
a) buy when growthb) sell when no growth
c) hold if long growth
d) sell if short growth
Spritzer - 8 Mar 2017


Chart 1 - daily chart apparently moving towards another low point, need to check if it break lower or have strong resistance in there.
Chart 2 - show there is banker fund buy at the 3 low point. consider this should be very strong support.
Chart 3 - once the short term fund come out can see the prie move up fast momentum.
Chart 4 - weekly chart show the stock moving side way.
Summary
characteristic of this stock is move up fast and drop fast.
observe the low point if not break thru can consider buy in.
or wait the short term fund sign then buy in.
SKPetrol - 8 mar 17


Chart 1 - daily chart show that it almost come to resistance of previous high.
if can break thru at once and rebound back and stand above resistance line means very strong.
Chart 2 - weekly chart have indicate there is big volume buy around rm 2 price. this is consider long term banker as the price have been drop since after that. so cost around this level consider safe.
Chart 3 - show the banker chips is almost 90% means it is in uptrend now. overall chart can notice the higher high and higher low. uptrend.
Summary
may consider buy in, but RSI have show too high. may buy in few time.
Tuesday, March 7, 2017
Taann - 7 Mar 17
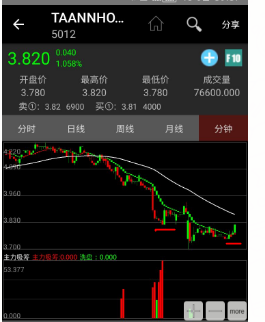


Entry
Buy at 4.81 on 7 Mar 17
Reason
Form the above chart.
First chart in 60 min, have shown got banker buy point and 2nd chart show short term fund move in.
means the momentum start.
also trend ladder have change from green to red.
3rd chart show the current position of the in short have show the position in end of C wave and starting new wave.
to follow up again

Review on 16 Mar 17
From the chart above can seen even there is banker chips but in compare to previous banker chips is still much lesser overall banker cost around 3.2. so this level should have strong support instead.
current chart is lower low and lower high. still in down trend.
How to select buy point
How to select buy point of stock
Some criteria to be consider for buy point.
a) what is the current position of the stock, refer to wave chart either is 1st wave or 3rd wave or abc wave. to know the position will be more safe and avoid to be in abc wave down trend.
b) buy plan. buy at what price and what is the target price, if there is history high, as long as trend higher high and higher low still consider uptrend.
c) Cut loss price, need to prepare mentally and action to cut loss when things go beyond the expectation, cut loss point can consider in 10% or break thru strong support/ long term trend.
d) Executed what you have plan to do, when do plan shall be rationale when executed shall overcome emotion and refer back to rational plan.
e) Case study of past trade to improve and accumulate lesson learn. increase more on forecast and prediction of direction.
Some criteria to be consider for buy point.
a) what is the current position of the stock, refer to wave chart either is 1st wave or 3rd wave or abc wave. to know the position will be more safe and avoid to be in abc wave down trend.
b) buy plan. buy at what price and what is the target price, if there is history high, as long as trend higher high and higher low still consider uptrend.
c) Cut loss price, need to prepare mentally and action to cut loss when things go beyond the expectation, cut loss point can consider in 10% or break thru strong support/ long term trend.
d) Executed what you have plan to do, when do plan shall be rationale when executed shall overcome emotion and refer back to rational plan.
e) Case study of past trade to improve and accumulate lesson learn. increase more on forecast and prediction of direction.
Monday, March 6, 2017
CIMB - 6 Mar 17
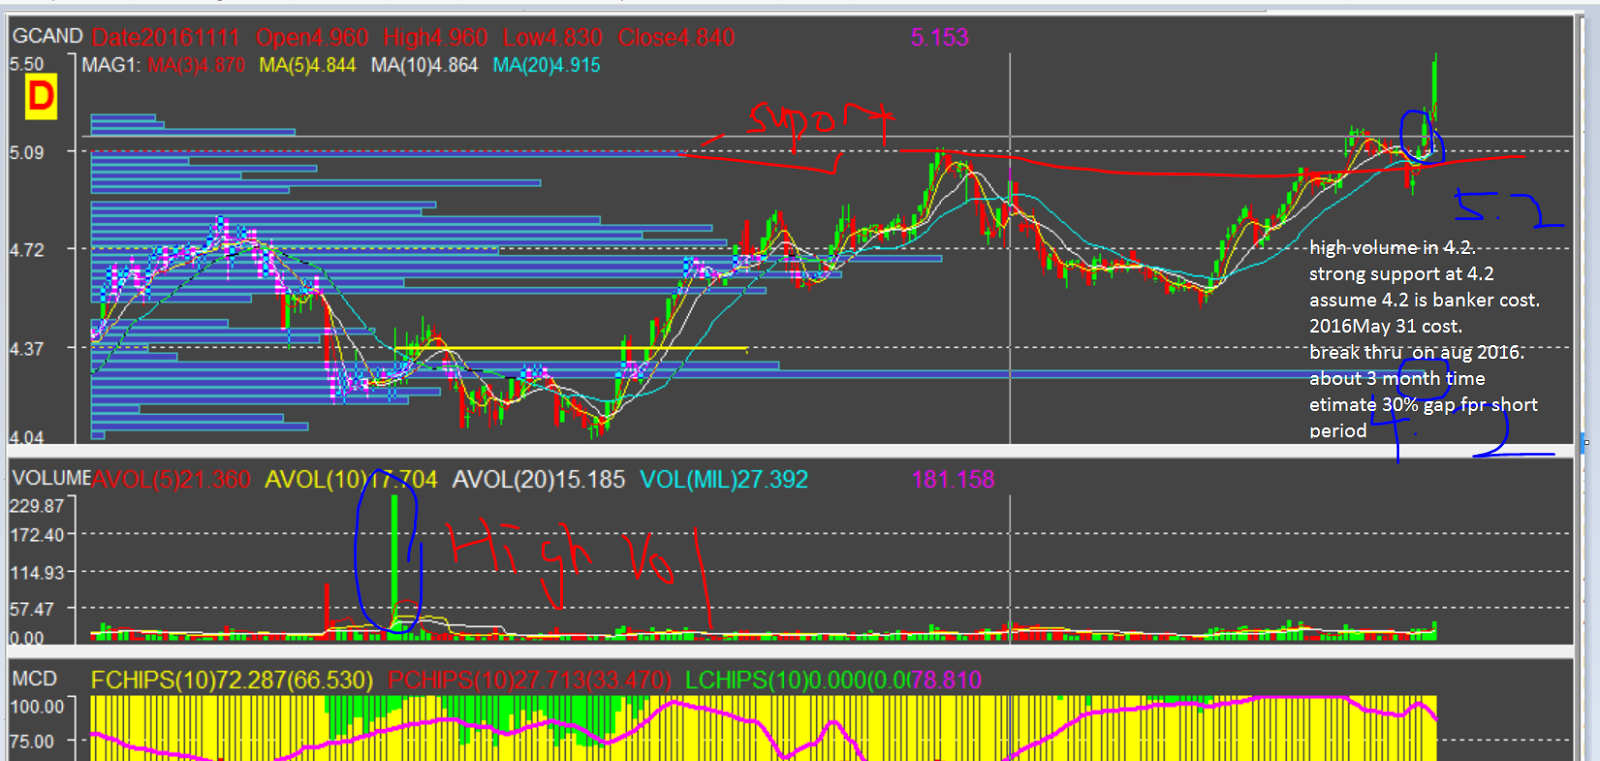

CIMB chart capture on 6 Mar 17.
Buy
Entry at 5.22 on 3 Mar 17.
Reason
From the 1st chart can seem the major cost is on 4.2 with current price about 5.4 about 28% gain from the banker cost. duration is < 6 month.
short term should be about 30 - 50% raise up gap.
but from the 2nd chart can observe the long term white line trend have turn from down towards up.
means going into bull for this stock.
Estimate it to be return to previous high at 6 to 7.
Follow up
To check again on next month Apr 17.
Subscribe to:
Posts (Atom)